Selection-geometry AUROC study
Question. The new projection-geometric metrics
(quality_correlation ρ(p,a), selection_saturation |Q|·√(αβ)/σ_p,
baseline_harm 1−E[p], selection_credit β·Q) were motivated as
cleaner cross-scenario signals than raw toxicity. Does that hold up
when the discrimination task is set up to be hard?
v1 → v2 revision. The first version of this study (committed with
f_low=0.10, f_high=0.40, N=200, noiseless v̂) hit AUROC=1.000 on multiple metrics — saturated discrimination, no useful comparison. v2 below tightens the contrast to a 5pp f-gap with N=50 batches and noisyv̂, so the metrics actually compete. Conclusions below differ in location (which θ saturation is best at) and in strength (no non-trivial metric hits 1.0).v3 extension: evasive adversary. v2 used non-adaptive adversaries — their
v̂honestly reflected their lowp. v3 adds av̂-inflation knob: adversarial interactions getv̂ += inflationwhilepstays low. This models proxy gaming with no real quality work (the cause-3 pattern from the arm-2 line). Inflation ∈ {0.0, 0.3, 0.6}; everything else identical to v2. The complementarity story from v2 reverses: under evasion, toxicity strengthens and saturation weakens, exactly because the adversary breaks the(v̂, p)coupling that saturation depends on.
Procedure
- For adversarial fractions f ∈ {0.05, 0.10, …, 0.45}, compose populations of N=50 interactions by mixing benign + toxic fixture batches.
- For governor strictnesses θ ∈ {−0.6, −0.3, 0.0, +0.3, +0.6}, label
acceptance as
(v̂ + ε) > θwith ε ~ 𝒩(0, σ=0.25). The noise onv̂keeps the governor from being a perfect oracle onp— without it the acceptance rule is a deterministic function ofpand the discrimination is artificially trivial. - Five metrics on every (f, θ, seed) cell; K=400 seeds per cell → 18 000 cells total, ~12 s single-core.
- Binary label: adversarial if f ≥ 0.30, benign if f ≤ 0.25 — a 5-percentage-point gap. AUROC per (metric, θ) pooled across those cells.
Reproduce: python -m experiments.selection_geometry_auroc --seed 2026.
Result
| metric | θ=−0.6 | θ=−0.3 | θ=0.0 | θ=+0.3 | θ=+0.6 | mean | std |
|---|---|---|---|---|---|---|---|
baseline_harm |
0.999 | 0.999 | 1.000 | 0.999 | 0.999 | 0.999 | 0.000 |
toxicity |
0.980 | 0.894 | 0.654 | 0.527 | 0.505 | 0.712 | 0.193 |
selection_saturation |
0.469 | 0.503 | 0.706 | 0.867 | 0.883 | 0.685 | 0.175 |
quality_gap |
0.798 | 0.751 | 0.455 | 0.096 | 0.017 | 0.424 | 0.323 |
quality_correlation |
0.531 | 0.497 | 0.294 | 0.133 | 0.117 | 0.315 | 0.175 |
(AUROC sign-oriented so "adversarial → high"; metrics with adversarial-low direction were negated before scoring.)
Three findings
1. baseline_harm ≈ 1.000 is a real result, not an artifact —
and it pins down when the new metrics actually matter. It says:
if you can directly measure E[p], the population mean dominates
everything else as a discriminator. In a real deployment you don't
get p for free — you observe v̂ plus the accept/reject decision,
and the proxy is noisy. The selection-geometry metrics are designed
for that observational regime. So the load-bearing comparison is
the bottom four rows: among signals that only see the selection
process, which one carries the most information?
2. Toxicity and saturation cross over at θ ≈ 0, sweeping the same total AUROC budget across opposite halves of the governor space.
- Lax governors (θ < 0): raw
toxicityAUROC 0.89–0.98; saturation 0.47–0.50. Toxicity is the right tool when the governor admits most interactions, because toxicity collapses to baseline harm (β → 1 ⇒ T → 1 − E[p]). - Strict governors (θ > 0): roles invert.
toxicity0.51–0.53 (chance);saturation0.87–0.88. Under heavy filtering the few accepted interactions don't carry population info; what does is the geometric question "how much sorting signal is the proxy giving us, relative to its theoretical ceiling?"
Mean AUROC across all θ is nearly tied (0.712 vs 0.685). The
value isn't that saturation beats toxicity in aggregate — it's
that the two signals are complementary in opposite regimes,
and saturation fills the strict-θ gap where toxicity reverts to
chance. Practically: if your governor's acceptance rate is
<50%, report saturation; if >50%, report toxicity; near 50%,
report both (this is exactly what MetricsReporter now does).
3. quality_gap strictly worsens with strictness — and goes
wrong-direction under strict governors. AUROC drops from 0.798
to 0.017 across the θ sweep. Combined with quality_correlation
mean 0.315 (also wrong-direction throughout), these confirm the
v1 finding's reframing: ρ(p,a) and Q measure sorting quality
given the population, not the population given the sorting. Use
them to compare governors against a fixed population, not to
detect adversarial populations against a fixed governor.
Why the location flipped from v1
In v1 (noiseless v̂, N=200), saturation peaked at θ=0. With a
deterministic governor and large batches, the balanced regime is
where the most sorting work happens (both α and β substantial), so
|Q| · √(αβ) is maximized — and saturation along with it.
In v2 (noisy v̂, N=50), the noise smears v̂ so that even a "lax"
threshold makes mistakes, and a "strict" threshold rejects only the
clearest-positive proxies. The strict regime now selects an
acceptance set whose p distribution is much narrower than the
rejection set's — so the sorting signal |Q| is huge relative to
the small σ_p of the accepted slice. Saturation grows with θ
because the bound σ_p/√(αβ) shrinks faster than |Q| does.
This is the right shape for a real-world story: when the governor is doing aggressive filtering, saturation tells you whether the proxy is hitting its ceiling.
Implications
- Report saturation alongside toxicity in every per-epoch
summary — they're complementary, not redundant.
MetricsReporter.format_report()andto_markdown()already do this; sweeps and dashboards should follow. - Acceptance rate is the regime selector. Below ~50% acceptance,
trust saturation over toxicity; above, the reverse. The
plot_selection_geometry()two-panel view encodes exactly this decomposition. - Don't use ρ(p,a) to detect adversarial populations. It's a governor-quality metric given the population. Use it for A/B comparisons of governors, not for population monitoring.
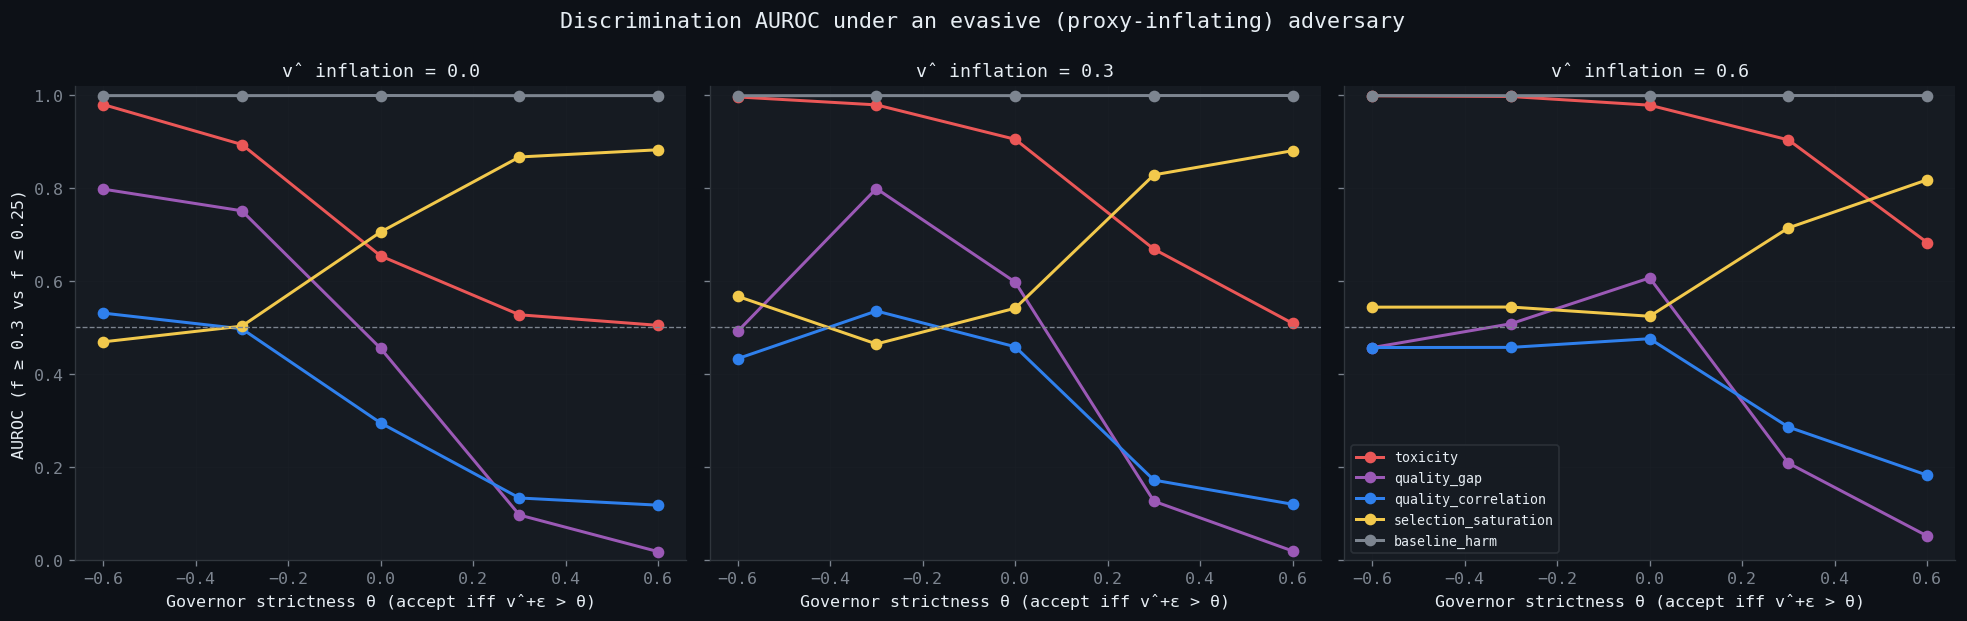
v3: under an evasive (proxy-inflating) adversary
For inflation ∈ {0.0, 0.3, 0.6}, adversarial interactions get
v̂ ← v̂ + inflation (clamped to [−1, +1]); p and ground truth
unchanged. 54 000 cells total. The picture inverts:
| metric | infl=0.0 mean | infl=0.3 mean | infl=0.6 mean |
|---|---|---|---|
baseline_harm |
0.999 | 0.999 | 0.999 |
toxicity |
0.712 | 0.812 | 0.912 |
selection_saturation |
0.685 | 0.657 | 0.629 |
quality_gap |
0.424 | 0.407 | 0.366 |
quality_correlation |
0.315 | 0.343 | 0.371 |
Per-θ breakdown at strong evasion (inflation=0.6), where the inversion is most extreme:
| metric | θ=−0.6 | θ=−0.3 | θ=0.0 | θ=+0.3 | θ=+0.6 |
|---|---|---|---|---|---|
toxicity |
0.999 | 0.997 | 0.979 | 0.904 | 0.683 |
selection_saturation |
0.544 | 0.544 | 0.524 | 0.715 | 0.818 |
Three takeaways
1. toxicity is the metric the proxy-gamer makes better.
E[1−p|a=1] only cares whether low-p interactions get accepted.
A v̂-inflating adversary makes exactly that happen — at any θ.
Toxicity AUROC grows monotonically with inflation (0.71 → 0.81 →
0.91 mean). At strict θ in v2 it was at chance; at the same strict
θ under strong evasion it's at 0.68 and rising — because the
adversary now successfully ferries low-p interactions past the
threshold, lighting up the toxicity signal.
2. selection_saturation is the metric the proxy-gamer
breaks — and this is the diagnostic, not the failure. Saturation
measures |Q| · √(αβ) / σ_p. Inflation pushes low-p adversaries
into the accepted set and squeezes some high-p benigns into the
rejected set, shrinking |Q| precisely because the proxy is no
longer informative about p. Saturation AUROC degrades steadily
(0.69 → 0.66 → 0.63 mean) and loses its strict-θ advantage. The
fact that saturation drops while toxicity rises is the cause-3
signature: the proxy is being gamed when these two metrics
diverge in opposite directions.
3. baseline_harm is invariant. 0.999 across every inflation
level — the population is unchanged; only the proxy and the
acceptance rule are gamed. This is what makes it a useful invariant
if you have it. In a real deployment you usually don't, which is
exactly the setting these metrics exist for.
The new diagnostic that emerges
The pair (toxicity, saturation) carries information neither
metric does alone:
| pattern over time | interpretation |
|---|---|
| both flat near chance | governor isn't sorting, no adversarial pressure |
| toxicity up, saturation up | adversarial pressure, governor handling it |
| toxicity up, saturation down (gap opens) | proxy gaming — adversary inflating v̂ past the governor's calibration |
| toxicity flat, saturation high | governor at proxy ceiling, no adversarial pressure |
| toxicity flat, saturation low | governor lazy, no adversarial pressure either |
The third row is the load-bearing case. It's the cause-3 fingerprint
made visible by metric-pair geometry rather than by a separate
calibration anchor. A dashboard panel that plots
Δ(toxicity_AUROC, saturation_AUROC) across a sweep would flag
evasive adversaries even without ground truth.
Limits of v3
- Inflation is a static offset, not an adaptive policy. A CEM- trained adversary would push inflation up only when it pays off (near-θ regimes), making the gap appear in a more concentrated band. Worth re-running with the existing arm-2 CEM infrastructure.
- The inflation knob is applied uniformly to all adversarial interactions. A more realistic model would be a per-interaction inflation distribution, possibly correlated with how-much-the- adversary-needs-to-game (close to θ → more inflation, far from θ → don't bother). Would smooth the saturation drop but not reverse it.
Limits and unresolved
- Fixture populations aren't adaptive. An evasive adversary would
push
v̂close to θ on purpose, which collapses σ_p of the accepted slice further and would push saturation higher still — but it would also pushpcloser to the threshold, potentially loweringbaseline_harmAUROC. Worth running with an arm-2- style CEM adversary. - The governor here is a pure
v̂-threshold. SWARM governors fold reputation, transfers, externality costs. Those don't change the geometric story (saturation is independent of payoffs) but they do change which θ the system equilibrates at. - Saturation's wrong behavior at θ < 0 (AUROC < 0.5) is mild (0.469–0.503, basically chance) but real. Diagnose: under governors that reject almost nothing, σ_p of the accepted slice ≈ σ_p of the population, and the saturation ratio doesn't move much with f. Not a bug — a regime boundary worth knowing.
Artifacts
- Per-cell CSV:
runs/sg_auroc_v2/cells.csv(18 000 rows × 9 columns) - Plots:
runs/sg_auroc_v2/plots/ - Reproduce:
python -m experiments.selection_geometry_auroc --seed 2026