Selection geometry: when a metric breaking is the diagnostic
The setup
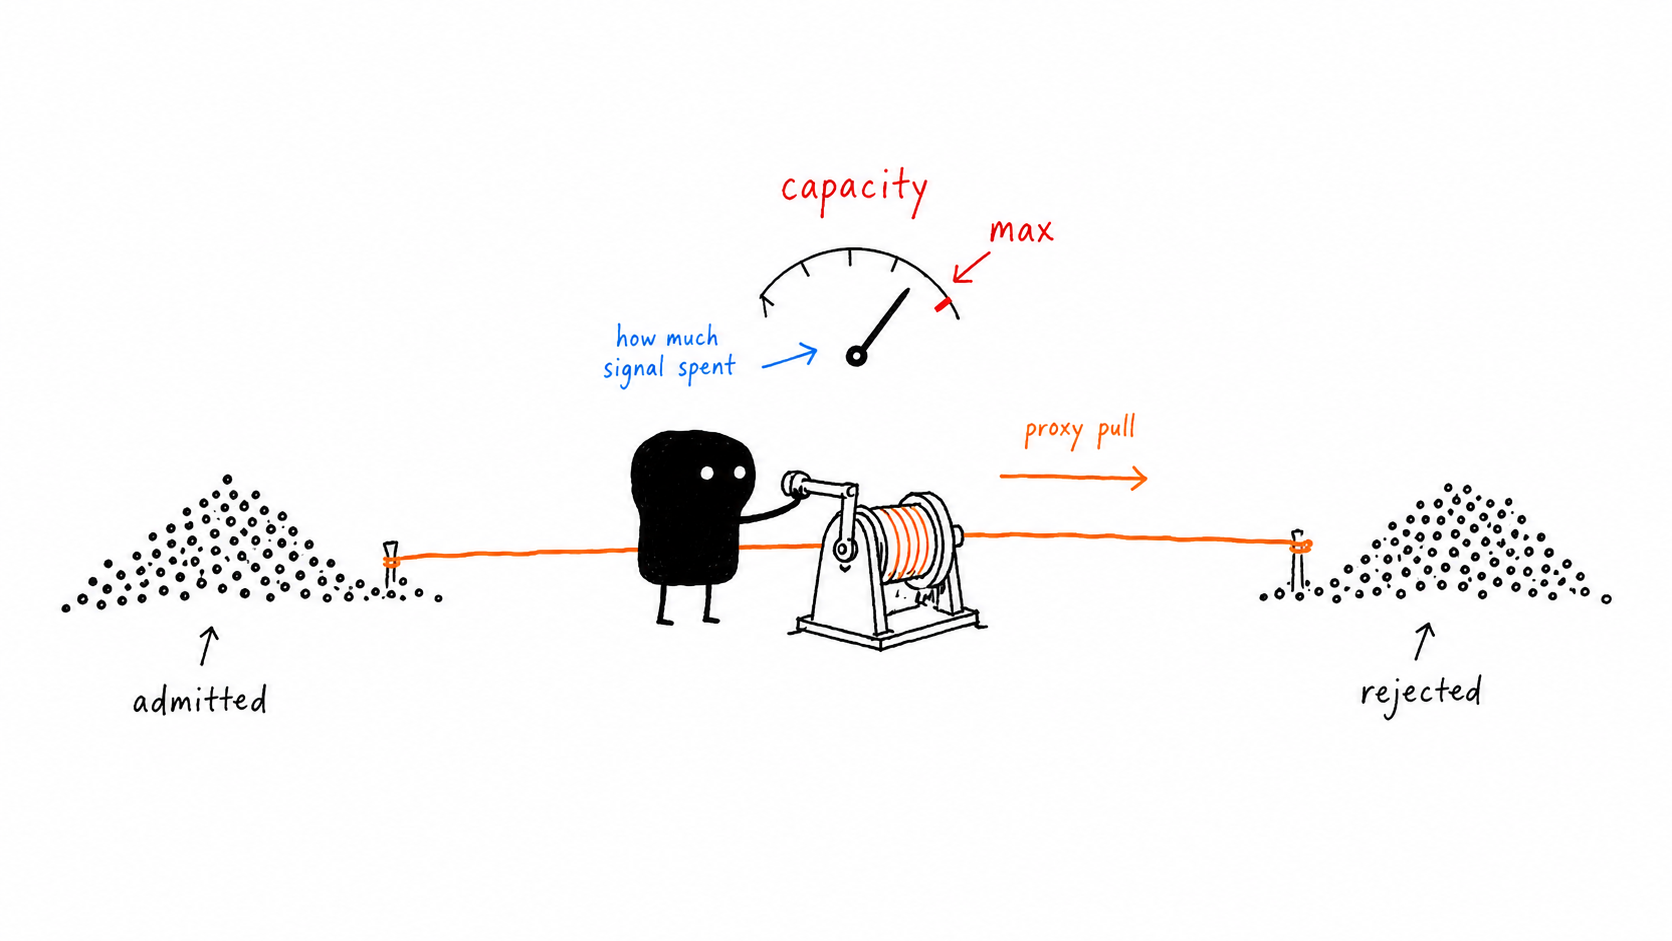
If interactions have soft labels p = P(v=+1 | observables) and a governor accepts a subset a ∈ {0,1}, the quality gap
Q = E[p|a=1] − E[p|a=0]
is the standard adverse-selection metric in SWARM. A negative Q means the governor is preferentially admitting low-quality interactions — the classic adverse-selection diagnosis.
If you rewrite Q as a covariance,
Q = Cov(p, a) / Var(a),
it becomes the regression coefficient of p on a. Cauchy-Schwarz immediately bounds it:
|Q| ≤ σ_p / √(αβ), where α = P(accept), β = 1−α.
So there's a natural unit-normalized version — Pearson correlation ρ(p, a) ∈ [−1, +1] — and a saturation ratio that says what fraction of the C-S ceiling the governor is realizing:
selection_saturation = |Q| · √(αβ) / σ_p ∈ [0, 1].
A governor saturating its bound is doing all the sorting the proxy will let it. A governor near the ceiling can't be improved by tighter policy — it needs a better proxy.
The decomposition is also clean: T = baseline_harm − selection_credit, where baseline_harm = 1−E[p] is the population floor and selection_credit = β·Q is what governance can move.
That's the metric. Does it carry information beyond raw toxicity?
Study v1: AUROC = 1.0 means nothing
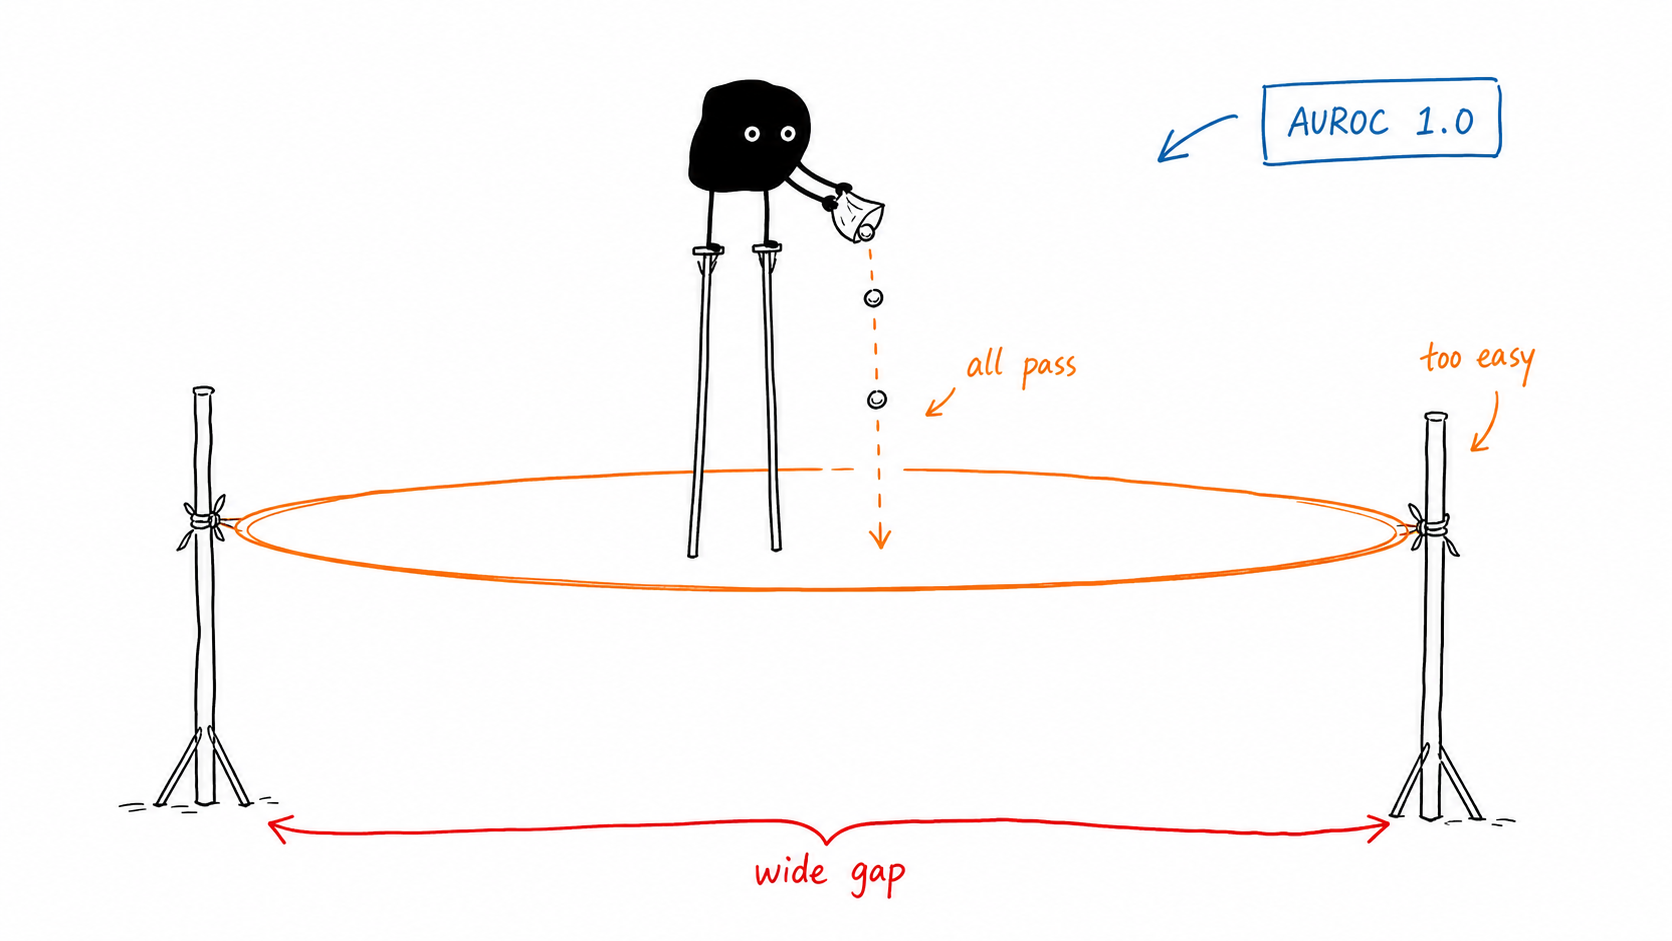
The first sweep was a 9 000-cell discrimination task: mix benign + adversarial fixture batches at fraction f, run them through a v̂ > θ governor, ask which metric best distinguishes adversarial populations (f ≥ 0.4) from benign ones (f ≤ 0.1).
Result: baseline_harm, toxicity, and selection_saturation all hit AUROC = 1.000 somewhere. The contrast was a 30-percentage-point f-gap with N=200 batches and a noiseless v̂ — the discrimination task was too easy. Saturated AUROC means the experiment isn't measuring anything.
Study v2: harder contrast, X-pattern
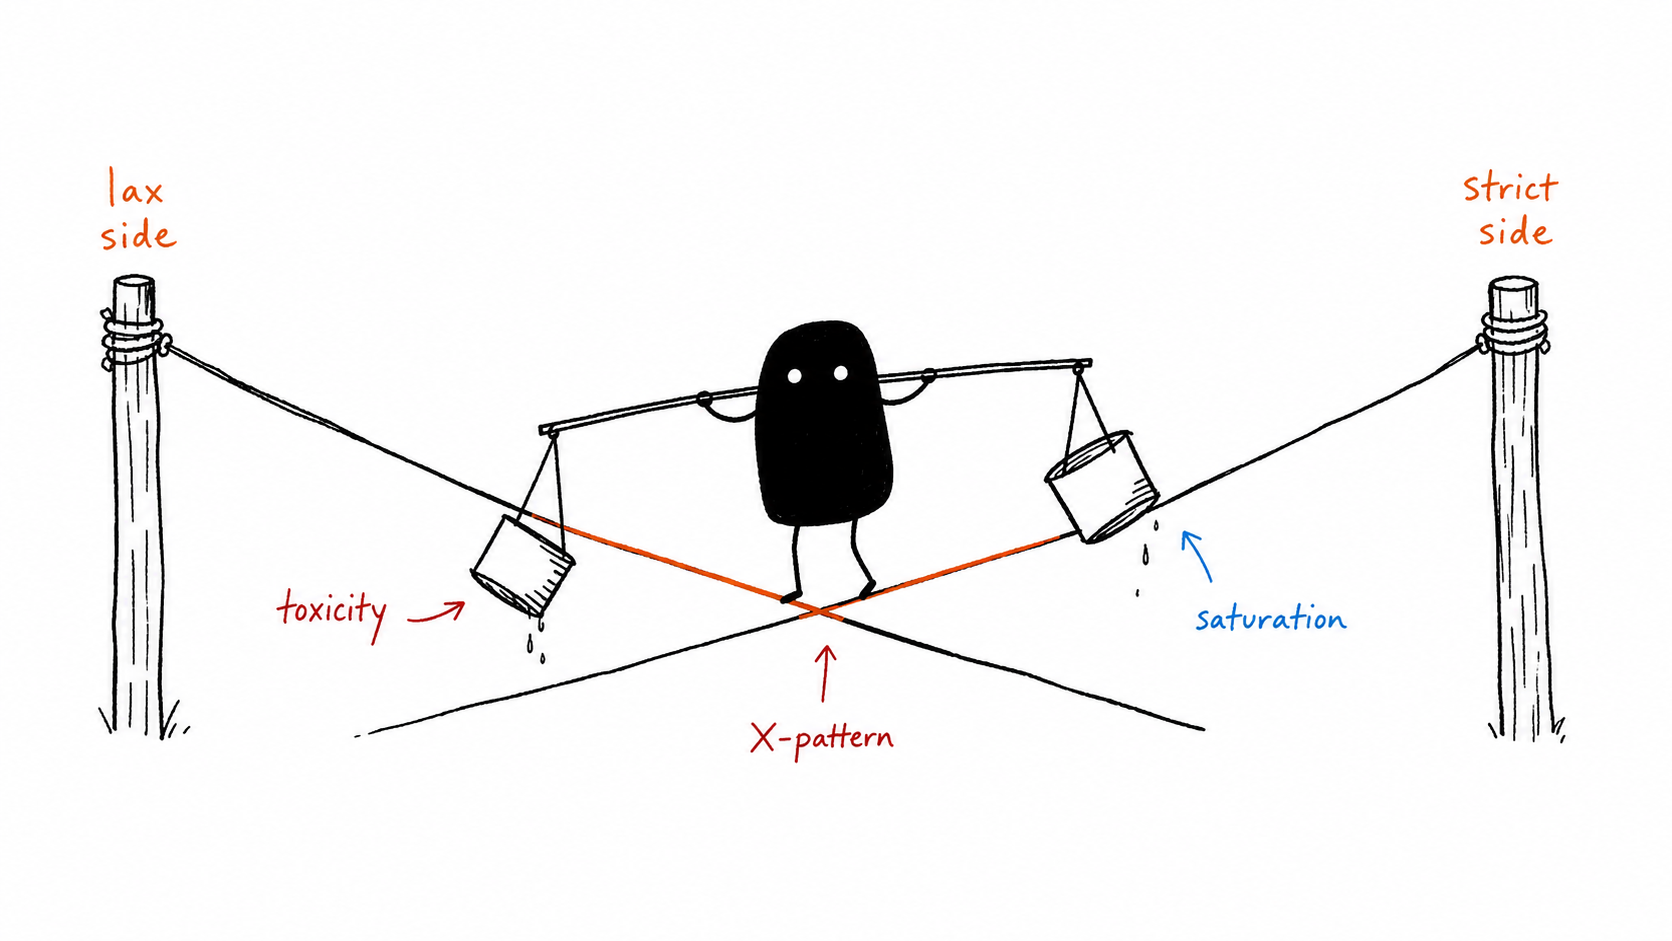
So we tightened it. 5pp gap (f ≤ 0.25 vs f ≥ 0.30), N=50 batches, v̂ + 𝒩(0, 0.25) so the governor isn't a perfect oracle on p. 18 000 cells.
The middle panel (inflation=0.3) shows the v2 picture cleanly:
- Lax governors (θ < 0): raw
toxicitywins (AUROC 0.89–0.98); saturation is near chance (0.47–0.50). Toxicity collapses to baseline harm when β → 1 — it just is the population mean. - Strict governors (θ > 0): roles invert. Toxicity at chance (0.51–0.53); saturation peaks (0.87–0.88). Under heavy filtering the accepted slice is tiny and its
pdistribution narrow, so|Q| / σ_psaturates. - Crossover at θ ≈ 0. Mean AUROC nearly tied (0.712 vs 0.685).
The two metrics aren't competing — they're complementary, sweeping the same AUROC budget across opposite halves of the governor space. The operational rule looked clean: report saturation when acceptance < 50%, toxicity when > 50%.
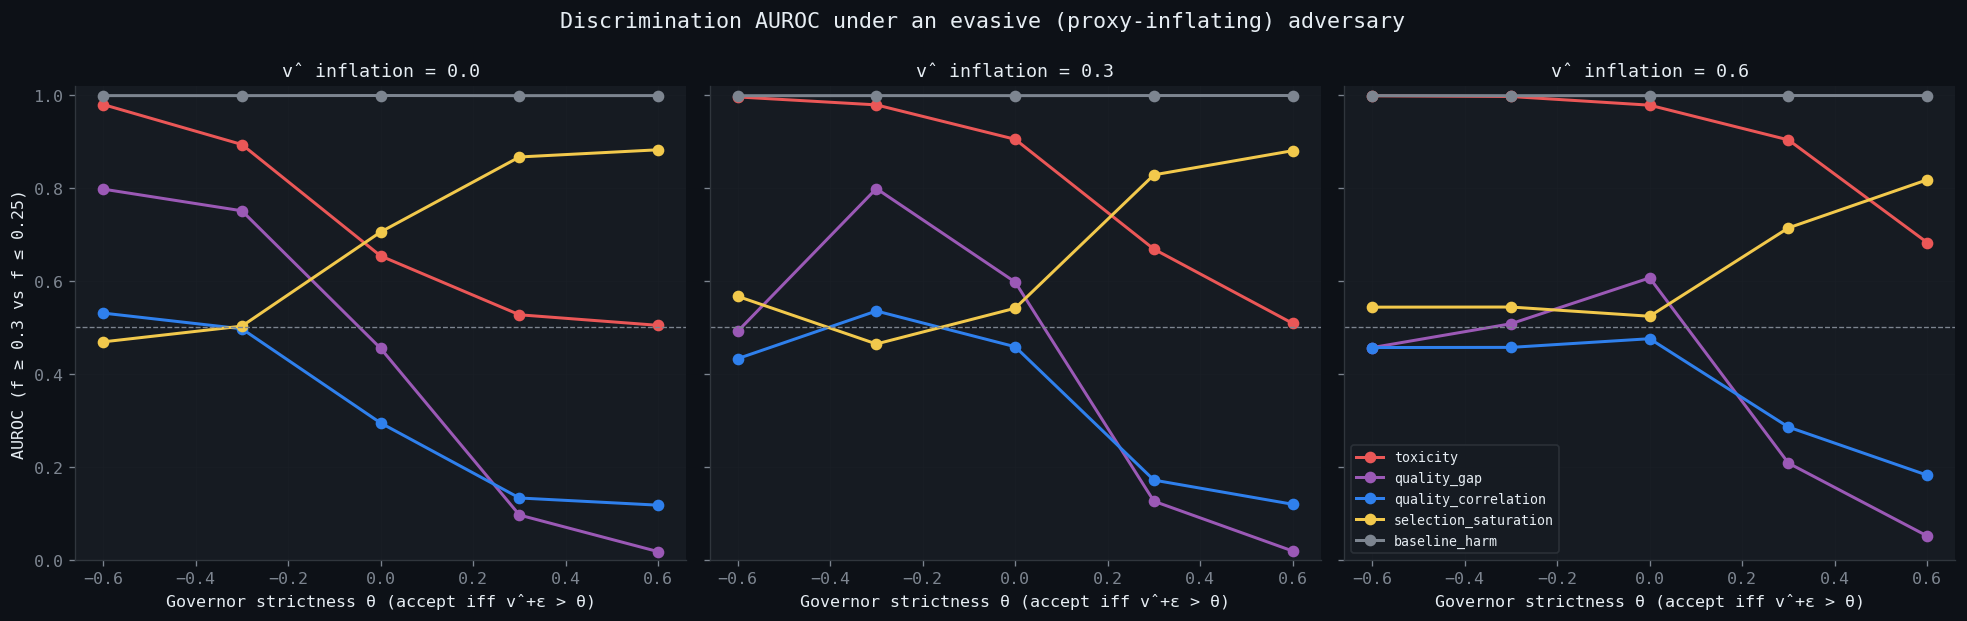
Study v3: an evasive adversary inverts the ranking
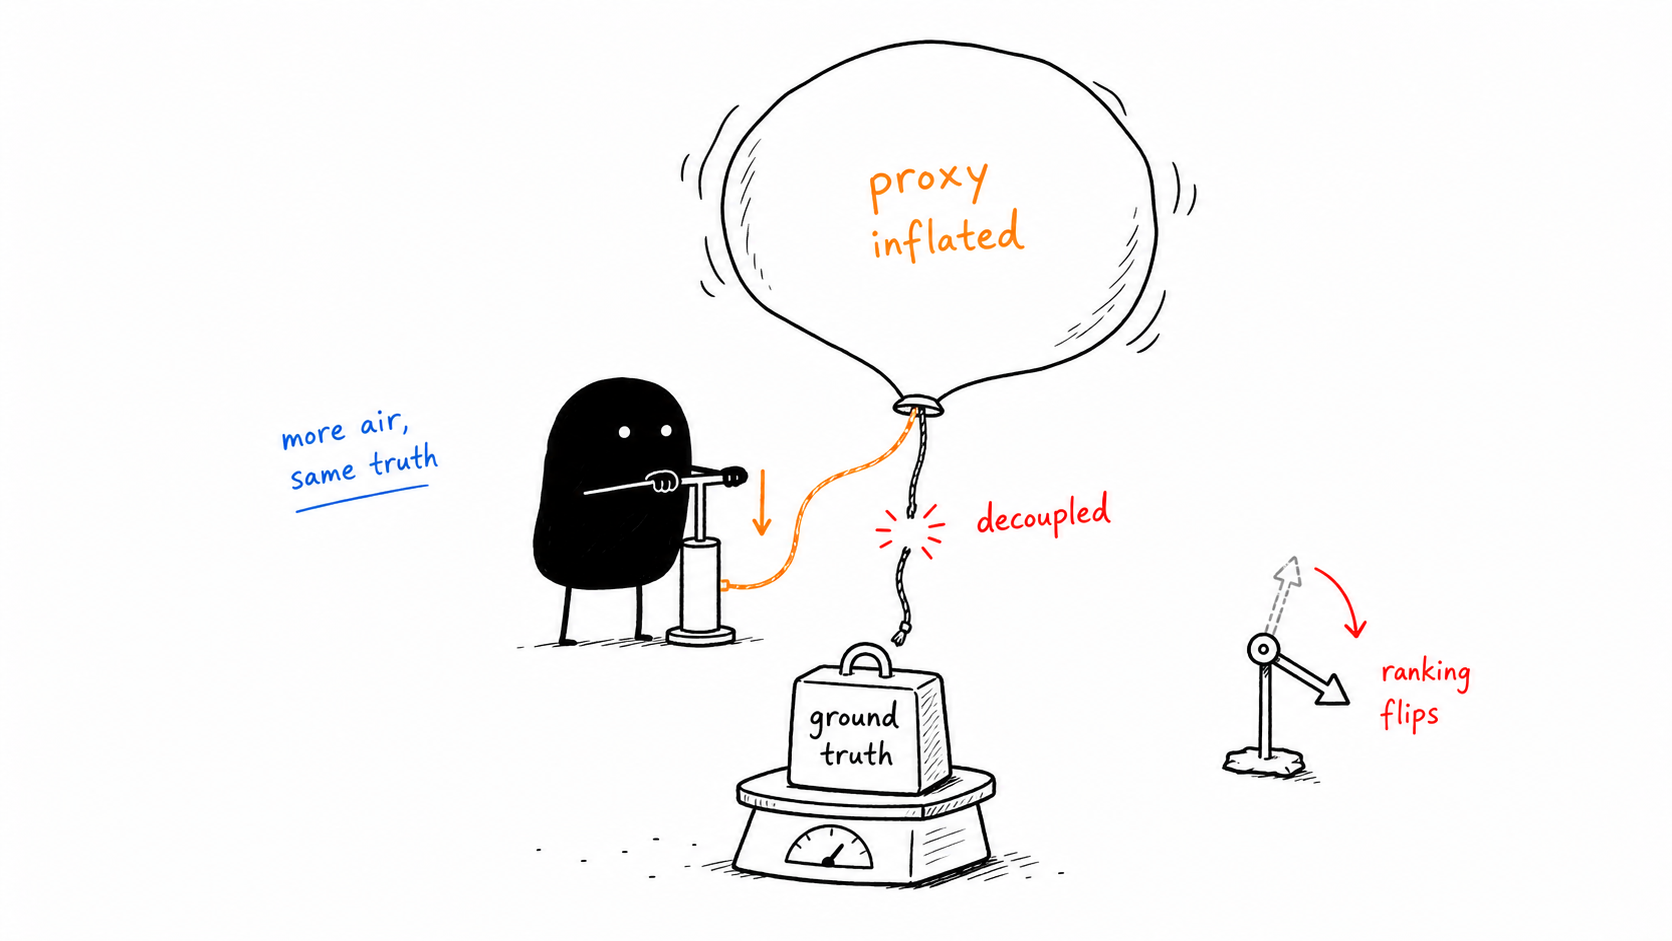
But every realistic adversary is adaptive. They learn how the governor works and game it. The cheapest gaming strategy is to inflate v̂ without changing real quality — the cause-3 pattern from the arm-2 line. So we added a v̂-inflation knob: adversarial interactions get v̂ += inflation while p stays low.
| inflation | toxicity mean AUROC | saturation mean AUROC | baseline_harm |
|---|---|---|---|
| 0.0 (no evasion) | 0.712 | 0.685 | 0.999 |
| 0.3 (mild) | 0.812 | 0.657 | 0.999 |
| 0.6 (strong) | 0.912 | 0.629 | 0.999 |
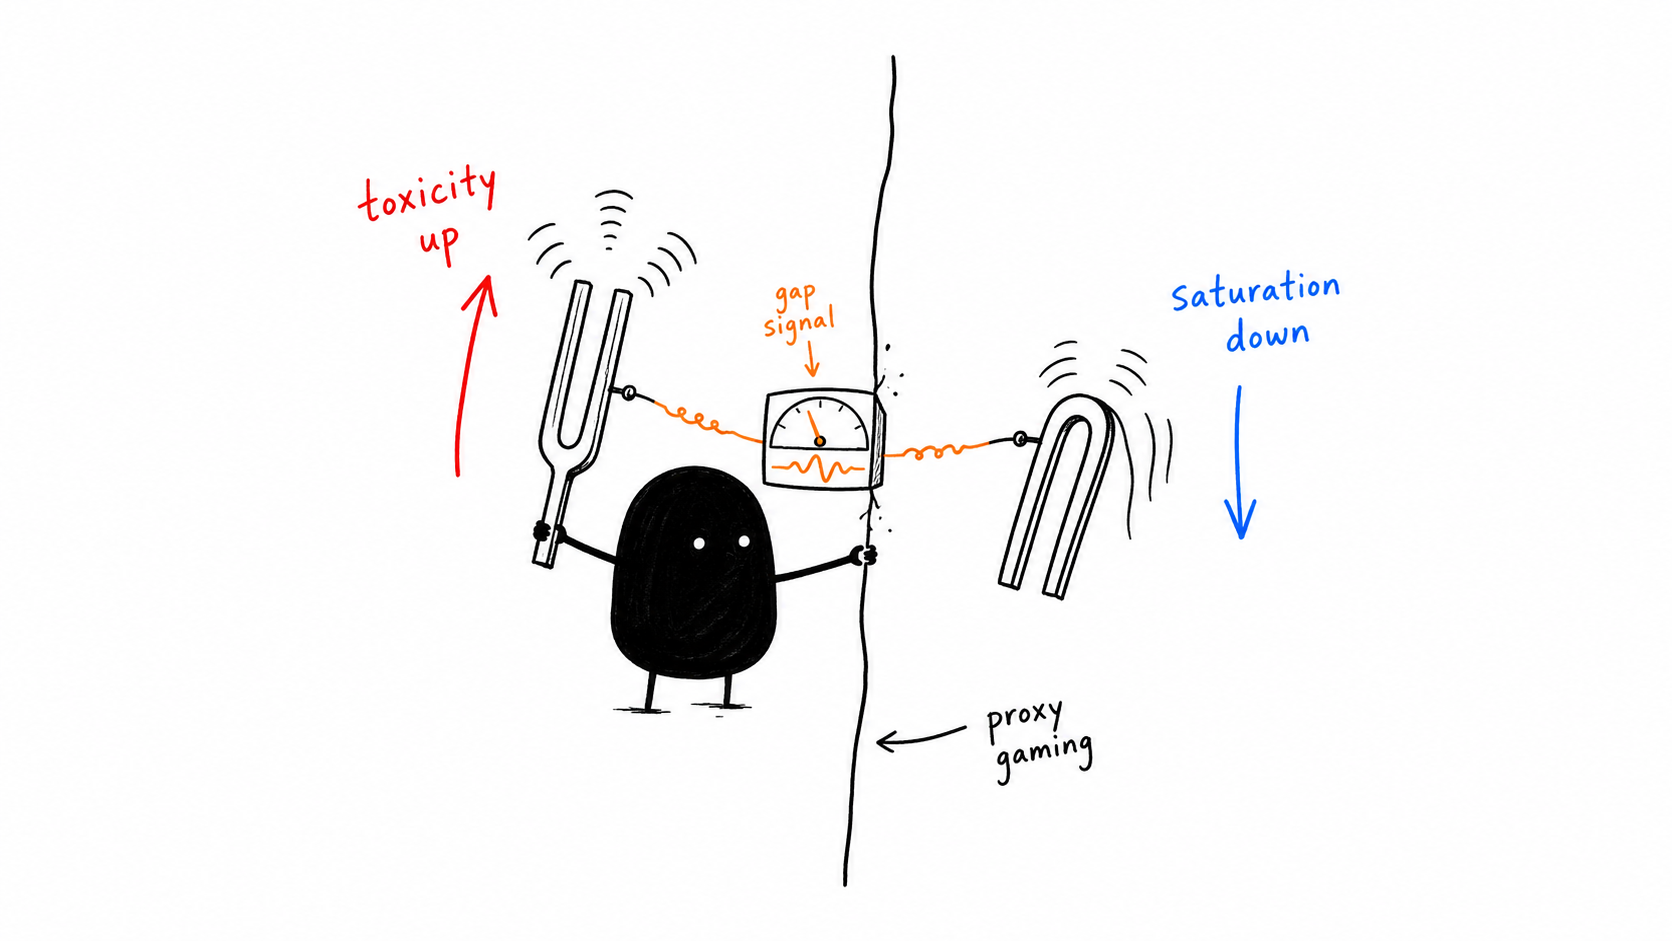
The v2 conclusion reverses. Toxicity gets stronger as evasion increases; saturation gets weaker.
Why? The adversary is specifically attacking the (v̂, p) coupling:
- Toxicity measures
E[1−p | a=1]. It only cares whether low-pinteractions get accepted. The adversary makes that happen — inflatedv̂ferries low-padversaries past the governor at every θ. Toxicity AUROC climbs because the signal it depends on gets louder under evasion. - Saturation measures
|Q| · √(αβ) / σ_p. Inflation pushes low-padversaries into the accepted set, draggingE[p|a=1]down and shrinking|Q|. The ratio collapses because the proxy is no longer informative aboutp. Saturation is the metric most damaged by exactly the attack it's supposed to flag.
And baseline_harm doesn't move. The population is unchanged; only the proxy is gamed. E[p] doesn't care.
The breakage is the diagnostic
You can read this as bad news for selection_saturation. But the more useful reading is that the pair (toxicity, saturation) carries information neither metric does alone:
| pattern across a sweep | interpretation |
|---|---|
| both flat near chance | governor not sorting, no adversarial pressure |
| both rising | adversarial pressure, governor handling it |
| toxicity rising, saturation falling | proxy gaming — adversary inflating v̂ past the governor's calibration |
| toxicity flat, saturation high | governor at proxy ceiling, benign population |
| toxicity flat, saturation low | governor lazy, no adversarial pressure |
Row three is the load-bearing case. The metric pair diverges in opposite directions exactly when the adversary is succeeding at proxy gaming. This is the cause-3 fingerprint, visible from observable metric geometry without ground truth, without a calibration anchor, without an audit log. A dashboard panel that plots Δ(toxicity_AUROC, saturation_AUROC) over time would flag evasion before any of the existing detectors fire.
What we set out to find was a better adverse-selection metric. What we got was that, but also: a metric that breaks under proxy gaming, and a companion metric that doesn't, and a diagnostic constructed from the gap between them. The first AUROC sweep gave the wrong answer because the experiment was too easy. The second gave a clean picture but missed the most important case. The third made the picture invert — and the invariance pinned down the new signal.
Reproduce it
54 000 cells in ~36 s, single-core. Full findings doc with per-θ breakdowns and limits is in selection-geometry-auroc-findings.md.
Disclaimer: This post uses financial market concepts (adverse selection, market microstructure) as analogies for AI safety research. Nothing here constitutes financial advice, investment recommendations, or endorsement of any trading strategy.